Baseline Emissions Footprint
Baseline emissions are a record of the greenhouse gases that have been produced in the past and were produced prior to the introduction of any strategies to reduce emissions. Baseline emissions are the reference point against which emissions reduction can be measured.
Baseline Year: 2015/16
Additional details relating to the baseline emissions calculations.
Through our ISO 14001 certification, PDMS has been measuring our emissions for some time. In doing so, we have been able to set our baseline measurement from the financial year 2015/16. Steady progress has already been demonstrated in our decreasing production of tCO2e across the business.
The baseline emissions calculations include all of PDMS’ activities across all sites. They have been broken down into three distinct scopes, as recommended by the UK Government.
It is envisaged that through future measures we will achieve our Net Zero emissions target.
Baseline year emissions are as follows:
- Scope 1: 125.21 tCO2e
- Scope 2: 35.32 tCO2e
- Scope 3: 50.03 tCO2e (including sources)
- Total emissions: 210.56 tCO2e
Current emissions reporting (1 Apr 2022 - 31 Mar 2023)

24.1 tCO2e
Scope 1

9.62 tCO2e
Scope 2

143.61 tCO2e
Scope 3

182.33 tCO2e
Total emissions
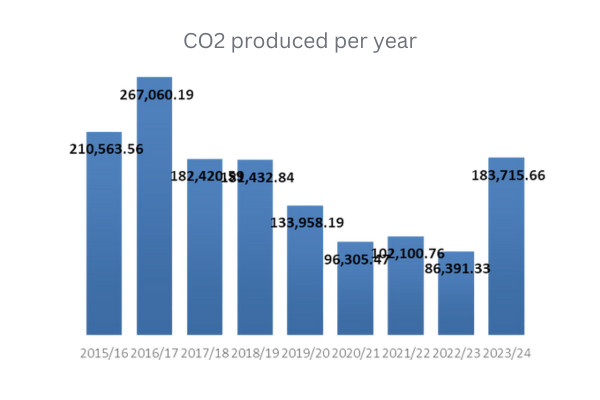
CO2 tonnes produced per year
Graph showing the number of CO2 tonnes produced by PDMS year on year:
Bar graph describing the CO2 tonnes produced per year. The X-axis shows the annual productions from 2015/16 to 2023/24 and the Y-axis shows the number of CO2 produced in tonnes. The trend has showed a gradual decline since 2016/17 before increasing sharply in 2023/24. The highest CO2 production was 267.06 tonnes in 2016/17 and the lowest production was 96.3 tonnes in 2020/21.


Emissions reductions target
In order to continue our progress to achieving Net Zero, we have adopted the following carbon reduction target.
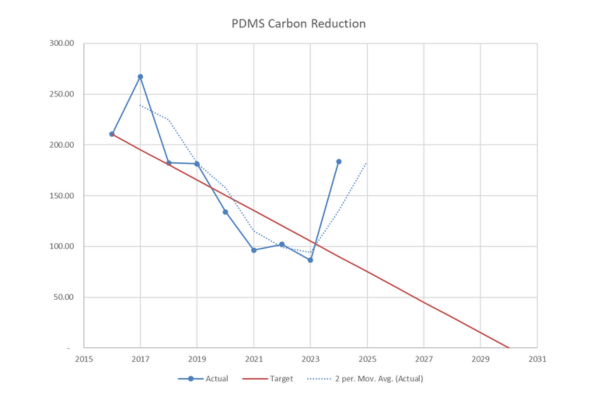
We project that carbon emissions will decrease over the next five years (end of 2028) to a value under 80 tCO2e.
Progress against these targets can be seen in the graph to the left.
A line graph describing PDMS' carbon reduction estimations The X-axis represents years from 2015 to 2031 at an interval of 2 years and the Y-axis represents carbon production in tonnes from 0 to 300 at an interval of 50 tonnes. The graph shows a steady decrease from 2015 to 2020 with a sharp increase in 2024 for the actual trend represented by the blue line, at a steeper gradient than the target red line which consistently declines to 2030. The light blue dotted line represents the Mov. Avg. (actual) decline which follows the similar decline and increase in 2024 as the actual results, with a more consistent and gradual decline to 2020.
Completed
Carbon reduction initiatives
The following environmental management measures and projects have been completed or implemented since the 2015/16 baseline, with the business already showing a 50%+ reduction in carbon production. To date we have completed:

Carbon offset
Offsetting of carbon production over the past 3 years, offsetting a total of 520 tCO2e.
Certification
Re-certification against ISO 14001:2015 to demonstrate our commitment to the environment

Reduction of travel
Reduction in travel, especially flights, preferring to use technology available.

Consolidation of IT resources
Consolidation of IT resources across the offices to reduce power consumption

Lighting
Installation of PIR lighting controls at our Glasgow office

Boiler replacement
Replacement of boiler at our Head Office with a more efficient model

Updating thermostat
Installation of smart thermostat system throughout our Head Office

Solar panels
Installation of solar panels at our Head Quarters

Carbon footprint portal
Invested in an online portal to accurately measure our carbon footprint and to advise on possible areas for improvement
In progress
Carbon Reduction initiatives
The active projects will further reduce our carbon production in the near future:

Mapping a path to Net Zero
Working out future initiative needed to achieve Net Zero and the path to achieving this
Future
Carbon Reduction initiatives
In future, we commit to explore further measures such as:

Energy use
Review of the energy performance of physical premises

Green energy
Swap to “green energy” for both offices and datacentres
EV points
Introduction of electrical vehicle charging points at our offices

Specialist support
Engage with third-party carbon measurement specialist to verify PDMS’ measurement techniques
Declaration and Sign Off
This Carbon Reduction Plan has been completed in accordance with UK Government PPN 06/21 and associated guidance and reporting standards for Carbon Reduction Plans.
Emissions have been reported and recorded in accordance with the published reporting standard for Carbon Reduction Plans and the GHG Reporting Protocol corporate standard [1] and uses the appropriate Government emission conversion factors for greenhouse gas company reporting [2].
Scope 1 and Scope 2 emissions have been reported in accordance with SECR requirements, and the required subset of Scope 3 emissions have been reported in accordance with the published reporting standard for Carbon Reduction Plans and the Corporate Value Chain (Scope 3) Standard[3].
This Carbon Reduction Plan has been reviewed and signed off by the board of directors (or equivalent management body).